Integrate metrics to a monitoring dashboard
Cloud-scanner can be used to export metrics related to the impact of your cloud account.
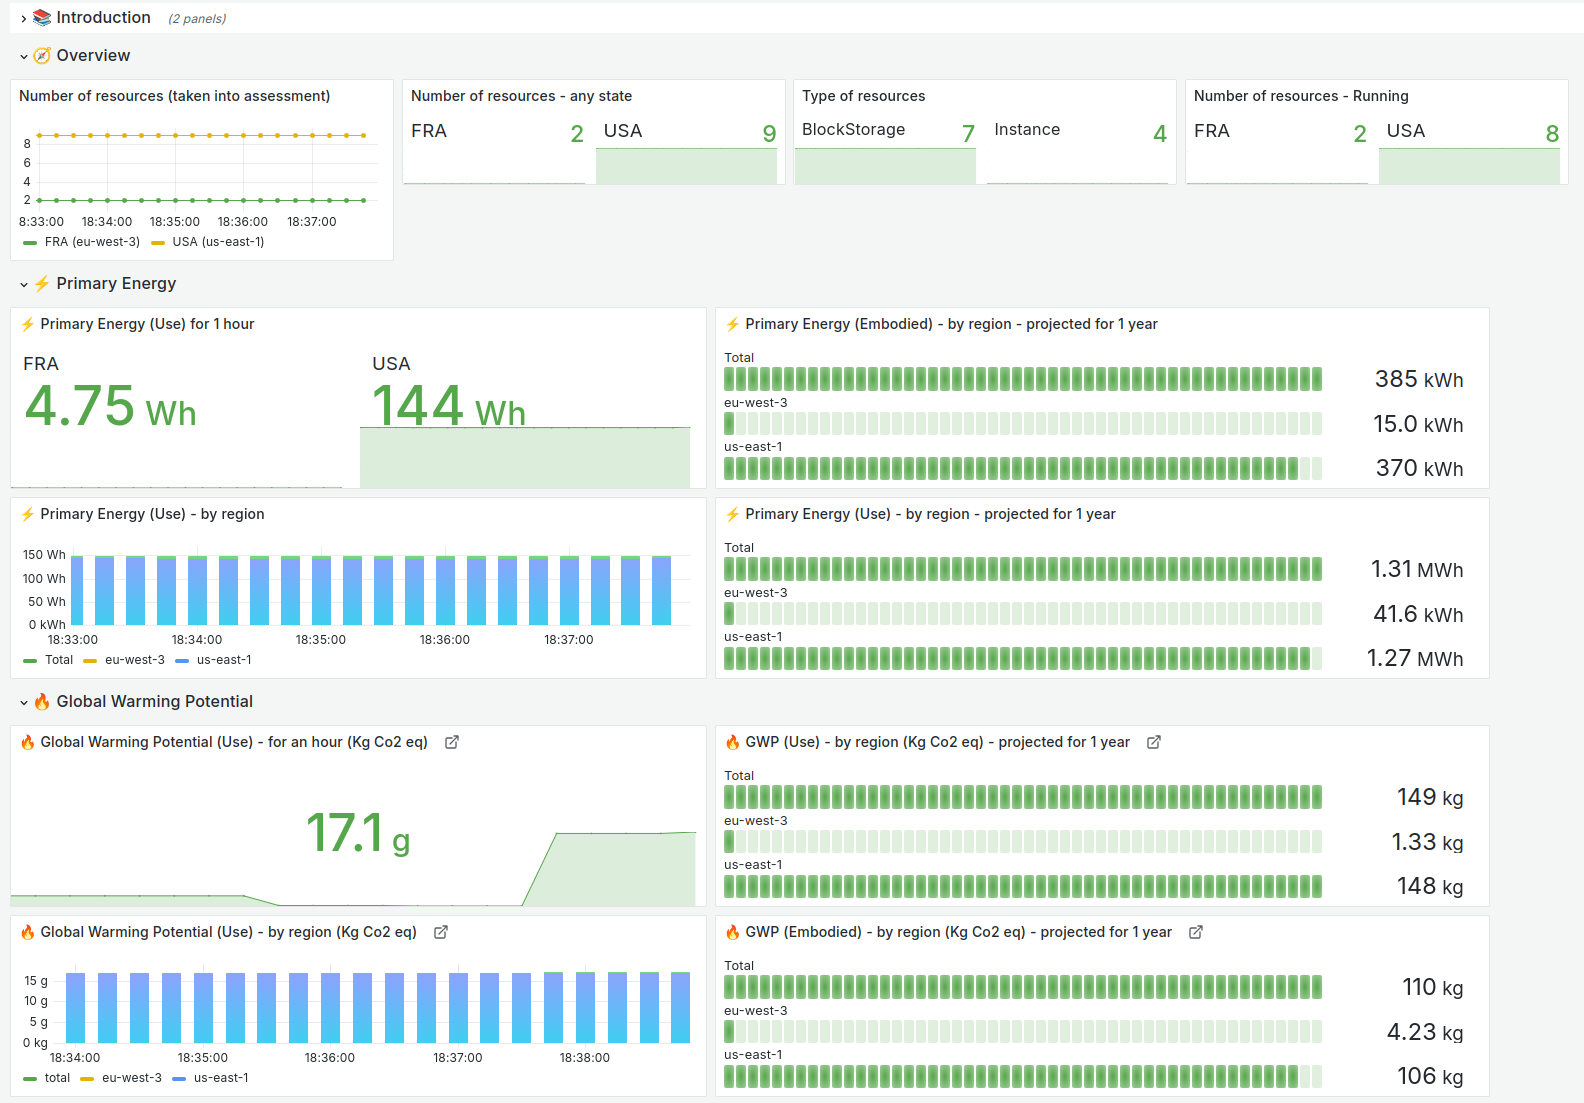
The metrics are exposed in Prometheus/OpenMetrics format. You can use it to feed a monitoring dashboard and keep an eye on the evolution of impacts of your usage.
Overview
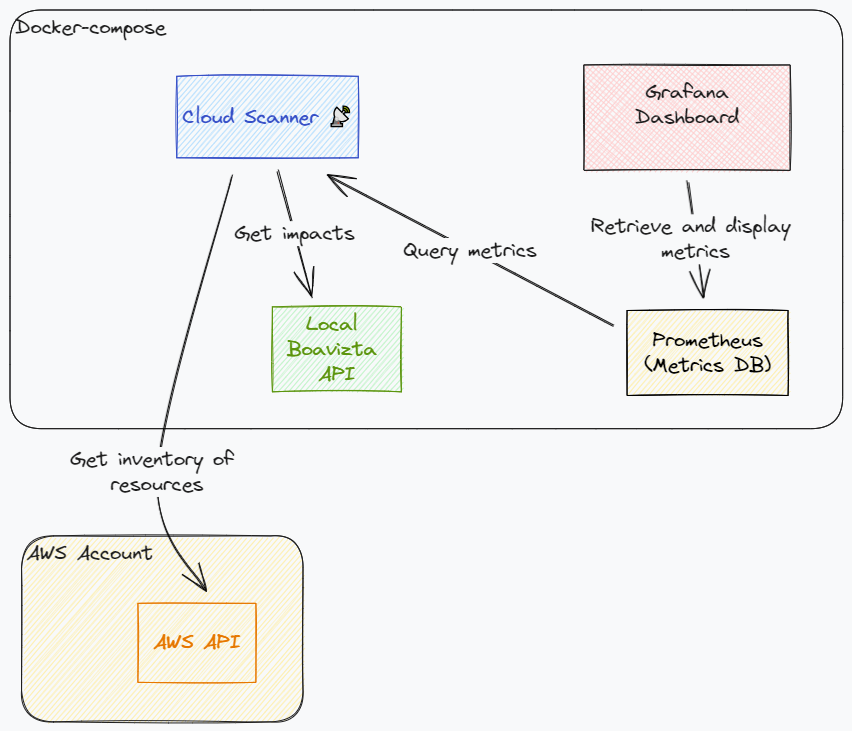
- Start cloud-scanner in metrics mode (using the
--serveoption or by deploying it as a serverless application). - Setup Prometheus to scrape the metrics. Metrics are generated separately for each region.
- Configure a dashboard to display the results.
Detailed steps
Demo for some EU regions.
You can refer to the provided docker compose example for a quick start.
It comes preconfigured to generate metrics for the following regions:
- eu-west-1
- eu-west-3
- eu-central-1
- us-east-1
Generating metrics for additional regions.
Examples of Prometheus and Grafana configuration files are located in the dashboard-config directories.
To generate (and display) metrics for an additional region:
- Edit the prometheus configuration (
prometheus.yml) - Add a new job and set its region parameter like
aws_region: ['us-east-2']. - Restart Prometheus container and verify that metrics are now collected for this region.
In the exemple compose stack, prometheus admin GUI is exposed. You can check status of the scrape targets at: http://localhost:9090/targets.
# Extract from prometheus.yml
# Example extra job configuration to cover us-east-2
  - job_name: 'cloud-scanner-metrics-us-east-2'
    scheme: http
    static_configs:
      - targets: ['cloud_scanner_boa:8000']
        labels:
          group: 'production'
    metrics_path: '/metrics'
    params:
      aws_region: ['us-east-2']
      include_block_storage: ['true']
Adapting configuration for production use:
In production environment, you may want to increase the metrics scraping interval.
This It is set to 30 seconds in the sample prometheus configuration. In production you shoud increase this intervall (e.g. 10 minutes).
# Prometheus scrapping interval / extract from prometheus.yml configuration
global:
  scrape_interval:     30s # By default, scrape targets every 30 seconds.
  evaluation_interval: 30s # Evaluate rules every 30 seconds.