Quick start : display dashboard using docker-compose 🐳
Visualize the live impacts of you account in a dashboard.
No installation needed, you will run a public docker image of cloud-scanner CLI, Boavizta API, Prometheus and Grafana to get access to a demo dashboard..
All data remain local to your environment (this docker-compose stack uses a private instance of Boavizta API).
Pre-requisites
- Docker and docker-compose
- A working AWS account (and your AWS CLI profile already configured)
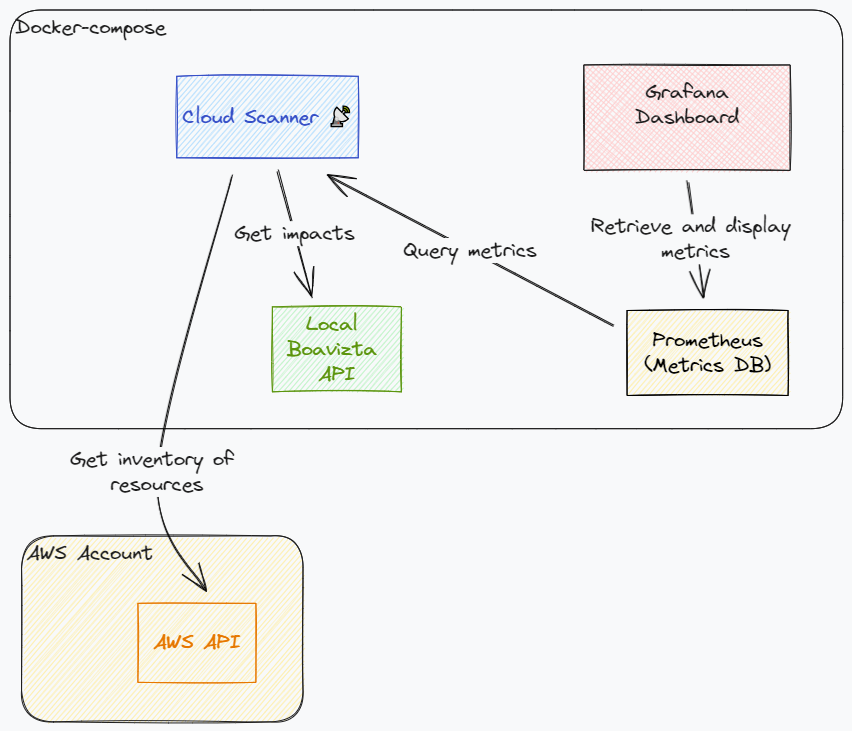
Run the demo dashboard
# Map your AWS credentials
export AWS_PROFILE=name-of-your-profile
# Start the stack (from the root of the repository)
docker-compose up
- Demo dashboard is exposed on http://localhost:3001
- Log in with user admin/admin
- Select the dashboard in the left menu.

⚠ The demo docker-compose is preconfigured to generate metrics only for the following regions:
- eu-west-1
- eu-west-3
- eu-central-1
- us-east-1
Refer to Generating metrics for additional regions to retrieve metrics for additional regions.
Additional info
- ⚠ This docker-compose example is not intended for production deployment, but rather for quick testing.
- ports of all services are exposed.
- Grafana is served on http with default login.
- You may have to update the line mapping your AWS profile (Replace
AWS_PROFILE=${AWS_PROFILE}byAWS_PROFILE=the-real-name-of-your-profile) when using Podman. It seems that Podman compose does not map the variables of the environment to the containers. - In corporate environments, you may need to provide your certificates authorities certificates (
ca-certificates) to the cloud-scanner container (uncomment the mapping line in the docker-compose file). - For the demo, we deliberately set a short metrics scrapping interval (30 seconds). In a production environment, you may want to increase this metric scraping interval to reduce the API calls and volume of data. This scrapping period is set in the Prometheus configuration file.